Showing posts with label Bureau of Labor Statistics. Show all posts

Wednesday, November 19, 2014

NRA releases new report on consumer spending

The National Restaurant Association this week released a new edition of its Consumer Spending in Restaurants report – an analysis of spending on food away from home by demographic groups. Last published in 2009, the report can help restaurant operators strategically plan their menus, services and marketing programs to build and maintain sales.

“Looking at demographics is extremely important for restaurant operators. One primary influencer on spending is income, in that the more cash-on-hand consumers have, the more they are likely to spend dining out,” said Hudson Riehle, senior vice president of the Research & Knowledge Group for the National Restaurant Association. “Our report breaks down income levels and other important factors to show how spending on food away from home can vary significantly according to household traits and composition.”

“For example, households with annual income above $70,000 comprise a third of all households but account for 56 percent of total spending on food away from home. And, young adults who have not yet reached their peak earning years spend less dining out when counting dollars, but a higher proportion of their total food budget compared with families with children,” Riehle said. 

According to the report, average household spending in restaurants was $2,678 in 2012 (or $1,071 per person), an increase of 2.2 percent over the previous year. Broken down by region, the Northeast and the West outspent the Midwest and the South. Breaking it down further by major U.S. city, Washington, D.C. led the nation both in levels of spending and proportion of total food budget spent in restaurants.

Based on 2012 Bureau of Labor Statistics data, Consumer Spending in Restaurantsbreaks down spending patterns by household income, age of household head, household size and composition, ethnicity, number of household earners and occupation. In addition, it breaks the information down by region, as well as Metropolitan Statistical Areas (MSAs) in each region.

As with all the NRA’s research publications, NRA members receive a 50 percent discount. For details, visit Restaurant.org/Research.

Tuesday, November 18, 2014

National Restaurant Association releases consumer spending in restaurants report

The National Restaurant Association (NRA) this week released a new edition of its Consumer Spending in Restaurants report – an analysis of spending on food away from home by demographic groups. Last published in 2009, the report can help restaurant operators strategically plan their menus, services and marketing programs to build and maintain sales.

“Looking at demographics is extremely important for restaurant operators. One primary influencer on spending is income, in that the more cash-on-hand consumers have, the more they are likely to spend dining out,” said Hudson Riehle, senior vice president of the Research & Knowledge Group for the NRA. “Our report breaks down income levels and other important factors to show how spending on food away from home can vary significantly according to household traits and composition.”

“For example, households with annual income above $70,000 comprise a third of all households but account for 56 percent of total spending on food away from home. And, young adults who have not yet reached their peak earning years spend less dining out when counting dollars, but a higher proportion of their total food budget compared with families with children,” Riehle said. 

According to the report, average household spending in restaurants was $2,678 in 2012 (or $1,071 per person), an increase of 2.2 percent over the previous year. Broken down by region, the Northeast and the West outspent the Midwest and the South. Breaking it down further by major U.S. city, Washington, D.C. led the nation both in levels of spending and proportion of total food budget spent in restaurants.

Based on 2012 Bureau of Labor Statistics data, Consumer Spending in Restaurants breaks down spending patterns by household income, age of household head, household size and composition, ethnicity, number of household earners and occupation. In addition, it breaks the information down by region, as well as Metropolitan Statistical Areas (MSAs) in each region.


As with all the NRA’s research publications, NRA members receive a 50 percent discount. For details, visit Restaurant.org/Research.
Monday, November 10, 2014

Restaurant labor indicators a mixed bag

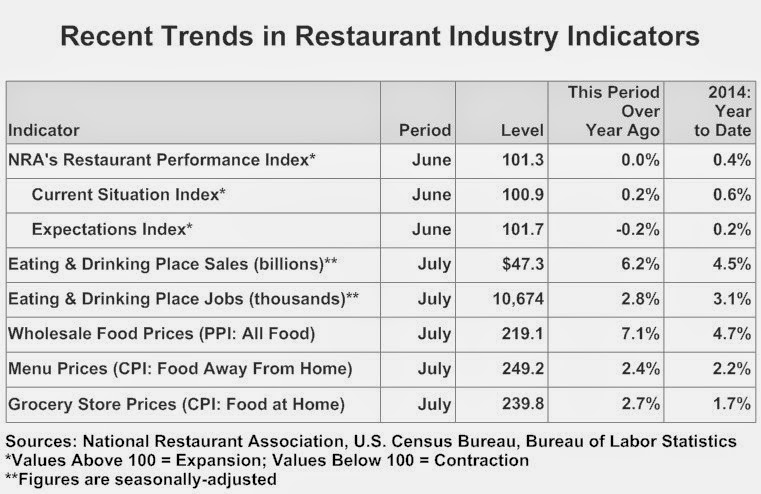
Restaurant industry job growth remained robust in October, adding jobs at its strongest rate in more than a year. Despite the continued payroll expansion, the average employee workweek was flat to somewhat lower for the major segments, according to the NRA’s Chief Economist Bruce Grindy. His Economist’s Notebook commentary and analysis appears regularly on Restaurant.org and Restaurant TrendMapper.

The restaurant industry continued to add jobs at a robust pace in October, according to preliminary figures from the Bureau of Labor Statistics (BLS). Eating and drinking places added a net 41,800 jobs in October on a seasonally-adjusted basis, their 56th consecutive monthly increase and strongest gain since May 2013.

Overall, the restaurant industry remains on pace to post job growth of at least 3 percent for the third consecutive year, which would mark the first such occurrence since the 1993 – 1995 period.

Within the restaurant industry, the snack and nonalcoholic beverage bar segment is leading the way in job growth. This segment – which includes concepts such as coffee, donut and ice cream shops – added jobs at a strong 5.5 percent rate on a year-to-date basis through September 2014. If this trend continues, it would represent the segment’s third consecutive year with employment gains above 5 percent.

The quickservice segment is also posting solid growth, adding jobs at a 3.6 percent rate during the first nine months of 2014. This puts the quickservice segment on pace to post job growth of at least 3.5 percent for the third consecutive year.

The fullservice segment added jobs at a 2.7 percent rate through the first nine months of 2014. While this is down somewhat from the consecutive 3.4 percent gains registered in 2012 and 2013, fullservice employment gains remain nearly a full percentage-point above job growth in the overall economy.  


While the industry continues to expand payrolls at a solid rate, the average workweek of employees is flat to somewhat lower for the major segments. According to BLS, the average weekly hours worked by non-supervisory employees in the snack and nonalcoholic beverage segment declined 1.0 percent on a year-to-date basis through September 2014.   

Meanwhile, the average workweek of quickservice restaurant employees declined 0.4 percent through September, while the average employee workweek in the fullservice segment was essentially flat. 

In contrast, average hours worked by food service contractor employees increased 9.0 percent in the first nine months of the year, while average weekly hours of employees in the catering and mobile foodservice segment rose 8.6 percent.


Thursday, February 7, 2013

Restaurant job growth hit 17-year high in 2012

In his latest commentary, the National Restaurant Association's Chief Economist Bruce Grindy looks back at 2012 jobs growth and offers projections for 2013. Restaurants added jobs at a strong 3.4 percent rate in 2012, the strongest increase in 17 years. Looking ahead to 2013, job growth in the restaurant industry is projected to outpace the overall economy by a full percentage-point.

The restaurant industry was an engine of growth for the nation’s employment recovery in 2012, and the trend is expected to continue in 2013. Eating and drinking places – the primary component of the restaurant industry which accounts for roughly three-fourths of the total restaurant and foodservice workforce – added jobs at a strong 3.4 percent rate in 2012, according to figures from the Bureau of Labor Statistics (BLS).
The robust restaurant industry job growth doubled the 1.7 percent gain in total U.S. employment in 2012, and represented the strongest increase since a 3.9 percent gain in 1995.

This disparity marked the continuation of a long-term trend, with 2012 representing the 13th consecutive year in which restaurant job growth outpaced the overall economy. In fact, during the last 13 years, the number of eating-and-drinking-place jobs jumped 25 percent, while total U.S. employment rose by only 4 percent.

Job growth within the restaurant industry was broad-based on 2012, with several of the major segments registering strong gains. Snack and nonalcoholic beverage bars – including coffee, donut and ice cream shops – set the pace with a robust 4.9 percent employment gain. Foodservice contactors (4.8 percent), quickservice restaurants (4.1 percent) and fullservice restaurants (3.0 percent) also added jobs at rates well above the overall economy in 2012. 

Looking ahead to 2013, job growth in the restaurant industry is projected to remain solid, albeit somewhat slower than the torrid pace registered in 2012. The National Restaurant Association expects restaurants to add jobs at a 2.7 percent rate in 2013, a full percentage-point above the projected 1.7 percent gain in total U.S. employment.

The projected 2013 gain will represent the 14th consecutive year in which restaurant industry job growth outpaces the overall economy, and the third consecutive year in which the industry registered job growth in excess of 2.5 percent. In comparison, the overall economy hasn’t posted job growth above 2.5 percent since 1998.

With the release of the February 1 jobs report, BLS included revisions that gave a clearer picture of employment trends during and after the recession. Restaurant employment fell 3.9 percent during the recession, while the overall economy lost 6.3 percent of its employment base.

The restaurant industry was certainly not immune from the effects of the Great Recession, with job losses in 2009 and 2010 representing just the second and third years on record that the industry cut staffing levels.

However, the restaurant industry bounced back quickly after the recession, with January’s employment level up 8.8 percent from the bottom of the cycle. In comparison, total U.S. employment is only up 4.3 percent from the recession trough. 

Overall, restaurant employment currently stands 441,000 jobs above its high-point before the recession, while the overall economy is still down 3.2 million jobs from the pre-recession peak.