Showing posts with label Economist's Notebook. Show all posts

Monday, March 23, 2015

Restaurant workforce demographics are shifting

The teen labor force participation rate declined sharply in recent years, a development that directly impacted the restaurant workforce.  Although restaurants are still the economy’s largest employer of teenagers, the shrinking teen labor pool has led many restaurant operators to look to alternative age cohorts to fill their staffing needs, according to the NRA’s chief economist Bruce Grindy.  His Economist’s Notebook commentary and analysis appears regularly on Restaurant.org and Restaurant TrendMapper.

The Great Recession and its aftermath had a significant impact on the U.S. labor force. The labor force participation rate fell to a 37-year low, with many people who lost jobs deciding not to return to the workforce. Contributing to this decline was the retirement of baby boomers, as well as a growing proportion of teenagers choosing to remain on the sidelines.

As the nation’s second largest private sector employer, the restaurant industry was directly impacted by these shifting labor demographics in recent years. Of significant note for the restaurant industry was the sharp decline in the teenage labor pool.

At its peak in the late 1970s, roughly 58 percent of 16-to-19-year-olds were in the labor force. This participation rate remained above 50 percent until 2001, when it started trending downward. The Great Recession exacerbated this decline, with the teen labor force participation rate plunging from 41.3 percent in 2007 to just 34.0 percent in 2014 – a record low.

The net effect was a decline of 1.4 million teenagers in the labor force between 2007 and 2014, a development that was reflected in the restaurant workforce. In 2007, 16-to-19-year-olds represented 20.9 percent of the restaurant workforce. By 2014, these teens made up only 16.6 percent of restaurant employees. 

To be sure, the restaurant industry is still the economy’s largest employer of teenagers, providing jobs for 1.5 million individuals between the ages of 16 and 19. Put another way, one-third of all working teenagers in the U.S. are employed in a restaurant. However, the shrinking teen labor pool has led many restaurant operators to look to alternative age cohorts to fill their staffing needs.

With teen representation in the restaurant workforce declining, a majority of the new restaurant jobs went to millennials in recent years. The share of restaurant jobs held by 20-to-24-year-olds rose from 21.4 percent in 2007 to 24.2 percent in 2014, while 25-to-34-year-olds also took on a larger role in the restaurant workforce.

Although older adults still make up a relatively small proportion of the restaurant workforce, they were the fastest growing demographic group in recent years. In fact, the number of adults aged 55 or older working in the restaurant industry jumped 38 percent between 2007 and 2014, an increase of 218,000 individuals. This trend is expected to continue in the years ahead, as older adults make up a larger share of the U.S. labor force.

Monday, November 10, 2014

Restaurant labor indicators a mixed bag

Restaurant industry job growth remained robust in October, adding jobs at its strongest rate in more than a year. Despite the continued payroll expansion, the average employee workweek was flat to somewhat lower for the major segments, according to the NRA’s Chief Economist Bruce Grindy. His Economist’s Notebook commentary and analysis appears regularly on Restaurant.org and Restaurant TrendMapper.

The restaurant industry continued to add jobs at a robust pace in October, according to preliminary figures from the Bureau of Labor Statistics (BLS). Eating and drinking places added a net 41,800 jobs in October on a seasonally-adjusted basis, their 56th consecutive monthly increase and strongest gain since May 2013.

Overall, the restaurant industry remains on pace to post job growth of at least 3 percent for the third consecutive year, which would mark the first such occurrence since the 1993 – 1995 period.

Within the restaurant industry, the snack and nonalcoholic beverage bar segment is leading the way in job growth. This segment – which includes concepts such as coffee, donut and ice cream shops – added jobs at a strong 5.5 percent rate on a year-to-date basis through September 2014. If this trend continues, it would represent the segment’s third consecutive year with employment gains above 5 percent.

The quickservice segment is also posting solid growth, adding jobs at a 3.6 percent rate during the first nine months of 2014. This puts the quickservice segment on pace to post job growth of at least 3.5 percent for the third consecutive year.

The fullservice segment added jobs at a 2.7 percent rate through the first nine months of 2014. While this is down somewhat from the consecutive 3.4 percent gains registered in 2012 and 2013, fullservice employment gains remain nearly a full percentage-point above job growth in the overall economy.  


While the industry continues to expand payrolls at a solid rate, the average workweek of employees is flat to somewhat lower for the major segments. According to BLS, the average weekly hours worked by non-supervisory employees in the snack and nonalcoholic beverage segment declined 1.0 percent on a year-to-date basis through September 2014.   

Meanwhile, the average workweek of quickservice restaurant employees declined 0.4 percent through September, while the average employee workweek in the fullservice segment was essentially flat. 

In contrast, average hours worked by food service contractor employees increased 9.0 percent in the first nine months of the year, while average weekly hours of employees in the catering and mobile foodservice segment rose 8.6 percent.


Tuesday, September 30, 2014

More higher-income households good news for restaurants

Household income remained stagnant in 2013, as the real median household income of $51,939 was essentially unchanged from its 2011 and 2012 levels. However, growth in the number of higher-income households may be a positive sign for the restaurant industry, according to the NRA’s Chief Economist Bruce Grindy. His Economist’s Notebook commentary and analysis appears regularly on Restaurant.org and Restaurant TrendMapper.

Household income remained stagnant in 2013, according to the latest figures from the U.S. Census Bureau. Real median household income was $51,939 in 2013, essentially unchanged from its 2011 and 2012 levels.  In addition, 2013 median household income stood 8 percent below its recent cyclical high of $56,436 in 2007. 

But looking inside the numbers, there are some positive signs for the restaurant industry, as the number of higher-income households rose for the second consecutive year. The number of households with annual income above $75,000 numbered 42.3 million in 2013 – up 3.7 percent from a total of 40.8 million in 2011. In other words, there were 1.5 million more households with income above $75,000 in 2013 than there were in 2011, after adjusting for inflation.   

The growth of the last two years came on the heels of a sharp decline in higher-income households during the Great Recession. Between 2007 and 2011, the number of households with annual income above $75,000 plunged 5.1 percent, or 2.2 million households. 

At the same time, the number of households with annual income below $25,000 soared 14 percent, or more than 3.7 million households. In addition, the number of households in the $25,000-to-$49,999 income category jumped 9 percent between 2007 and 2011.

As the economy improved during the last two years, the number of households with income below $25,000 remained steady, while households in the $25,000-to-$49,999 income bracket declined 1 percent. With growth being realized in the upper brackets, this suggests that households are moving up the income ladder as the recovery continues to firm. 

While the recent growth is a move in the right direction, the number of higher-income households still remained 700,000 below the record high reached in 2007, when there were 43.0 million households with income above $75,000.


The potential implications for the restaurant industry are significant, as higher-income households represent the majority of spending in the industry. According to data from the Bureau of Labor Statistics, households with incomes of $100,000 or higher are responsible for 36 percent of the total spending on food away from home, while households with incomes between $70,000 and $99,999 account for 18 percent of industry spending.

Wednesday, August 20, 2014

Restaurant indicators a mixed bag in 2014

The National Restaurant Association’s (NRA) Chief Economist Bruce Grindy looks back at trends in key indicators during the first half of 2014. Although overall sales are trending in a positive direction, rising food costs continue to pose challenges for restaurant operators.

Below is a breakdown of the trends in key indicators during the first half of the year, and what it all means for the restaurant industry in the months ahead.

Sales and Traffic
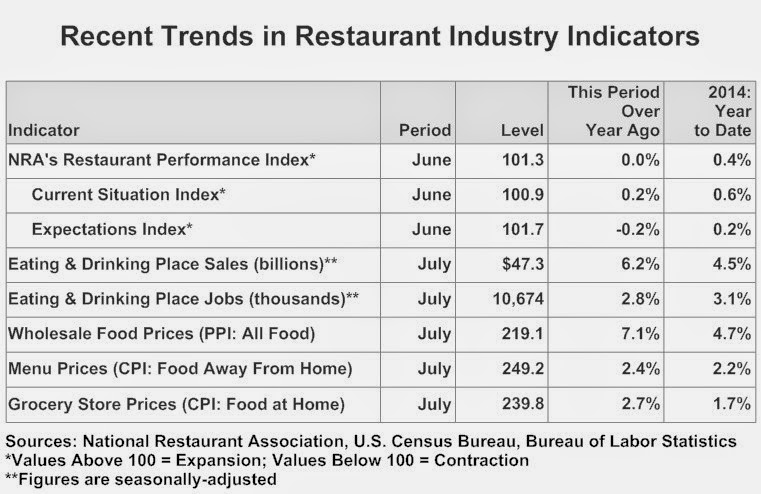
The NRA’s Restaurant Performance Index (RPI) stood above 100 during each of the first six months of the year, which represents expansion in the composite index of industry indicators.  Looking inside the RPI, the Current Situation indicators had a sluggish start to the year, which was due in large part to challenging weather conditions. 

As a result of soft same-store sales and customer traffic levels, the Current Situation component of the RPI fell below 100 in January and February, which signifies contraction.  However, sales and traffic results improved during the March – June period, and the Current Situation Index rose above 100 and into the expansion zone. 

Overall, restaurant industry sales trended in a generally positive direction during the first half of 2014.  Total eating and drinking place sales – which takes into account same-store sales as well as unit growth – reached a record high of $47.3 billion in July on a seasonally-adjusted basis, according to U.S. Census Bureau data.  Eating and drinking place sales were up 4.5 percent on a year-to-date basis through July, which is more than double the 2.2 percent increase in grocery store sales during the same period. 

Jobs
Along with an improving sales environment, the restaurant industry continued to add jobs at a steady pace in recent months.  Eating and drinking places added more than 187,000 jobs during the first seven months of 2014, which brings their post-recession growth to a total of nearly 1.4 million jobs. 

Overall, eating and drinking places added jobs at a 3.1 percent rate on a year-to-date basis through July, which is more than a full percentage-point above the 1.8 percent gain in total U.S. employment during the same period.  In addition, it puts the restaurant industry on pace to post job growth above three percent for the third consecutive year, which would represent the first such occurrence since the 1993 – 1995 period.

Food Costs
Meanwhile, the restaurant industry continues to be challenged by soaring food costs.  Average wholesale food prices registered sharp gains in six of the first seven months of 2014, according to the Bureau of Labor Statistics.  As a result, wholesale food prices were up 7.1 percent in the 12 months ending July 2014, which represented the strongest 12-month gain in nearly three years.  Overall, wholesale food prices are on pace to post their strongest annual increase in three years, and fifth consecutive annual gain overall. 

Menu Prices
While food costs have trended sharply higher, menu price gains have remained relatively tame.  According to the Bureau of Labor Statistics, menu prices rose 2.4 percent in the 12 months ending July 2014.  This was slightly below the 2.7 percent increase in grocery store prices during the same 12-month period, but above the 2.0 percent gain in overall consumer prices. 

If the trend holds, 2014 will mark the continuation of an extended period of relatively modest growth in menu prices.  Between 2009 and 2014, menu prices increased at an average annual rate of just 2.2 percent, well below the 3.6 percent average annual gain registered during the previous five-year period (2004 – 2009).  Moreover, average wholesale food prices increased at a 4.4 percent average annual rate between 2009 and 2014, which put considerable pressure on bottom lines during a challenging economic environment. 

Outlook
Despite the challenges, the underlying fundamentals point toward an improving business environment in the months ahead.  The national economy added more than 200,000 jobs in each of the last six months, which is a streak that last happened in 1997. 

In addition, real disposable personal income grew at annualized rates above 3 percent during the first two quarters of 2014.  We have to go back more than eight years to find consecutive quarters with income growth above the 3 percent level. 

An improving economy will help consumers become more confident in their personal financial situation, and put them in a better position to burn off their elevated pent-up demand for restaurants. 

For their part, restaurant operators are generally on board with an improving economic environment.  The RPI’s Expectations component, which measures restaurant operators’ six-month outlook for four industry indicators (same-store sales, employees, capital expenditures and business conditions), stood above 100 during each of the first six months of 2014.  This signifies that restaurant operators are generally optimistic about business conditions in the months ahead.

Read more from the Economist’s Notebook and get additional analysis of restaurant industry trends on the newly revamped Restaurant TrendMapper (subscription required)